Note: In order to access the AI dashboard, you must have safety analysis enabled. Learn more on how to turn on the AI features.
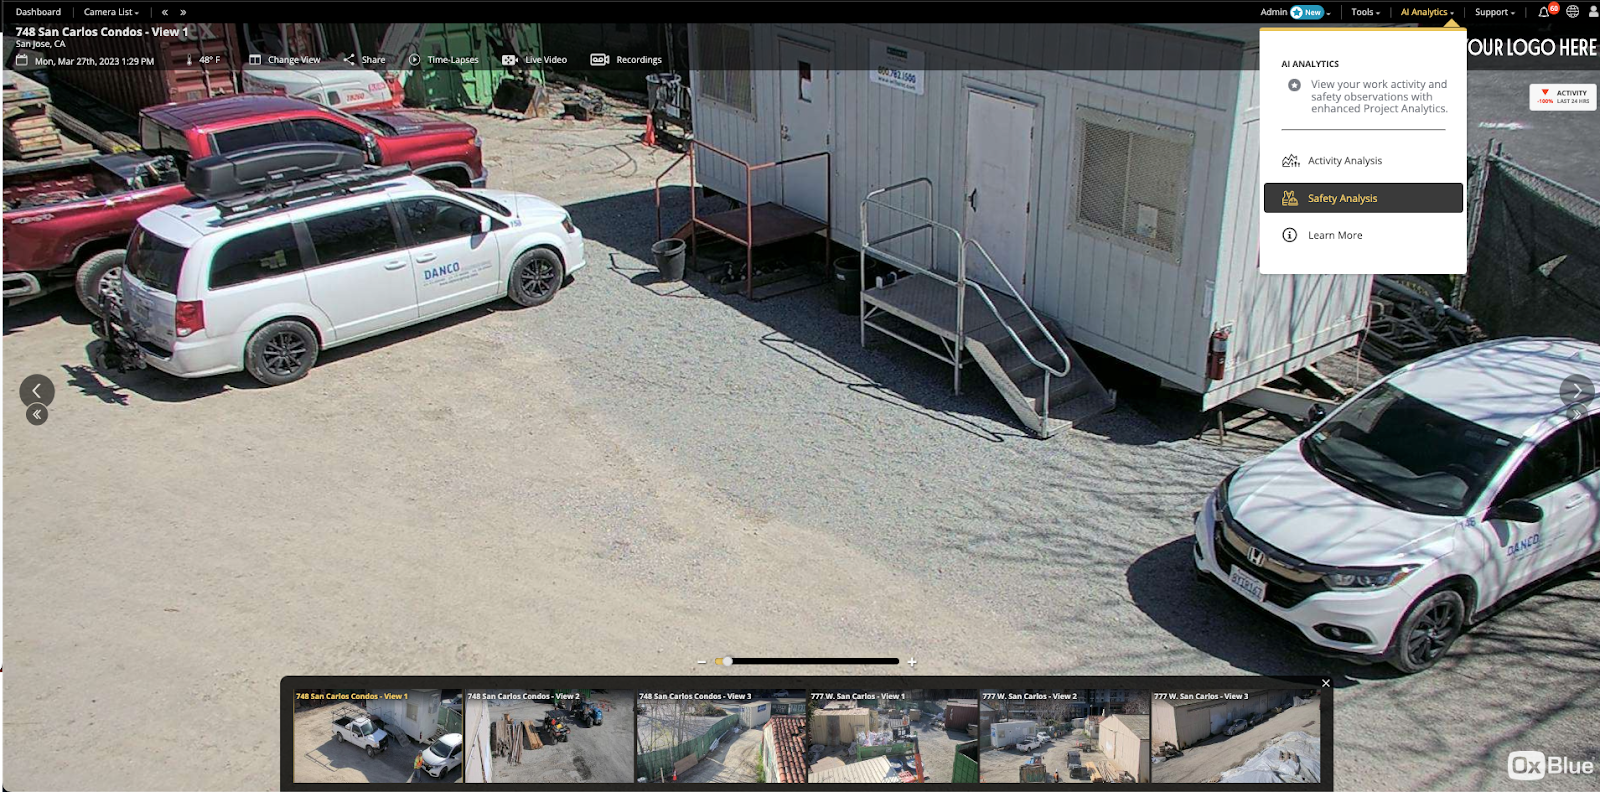
To view the Safety Analysis, simply click the Safety tab next to Activity. If you are not in the project analytics tab, click AI Analytics in the top-right menu and select Safety Analysis or the safety badge.
The AI Safety Analysis chart will be displayed to the right of the camera viewer.
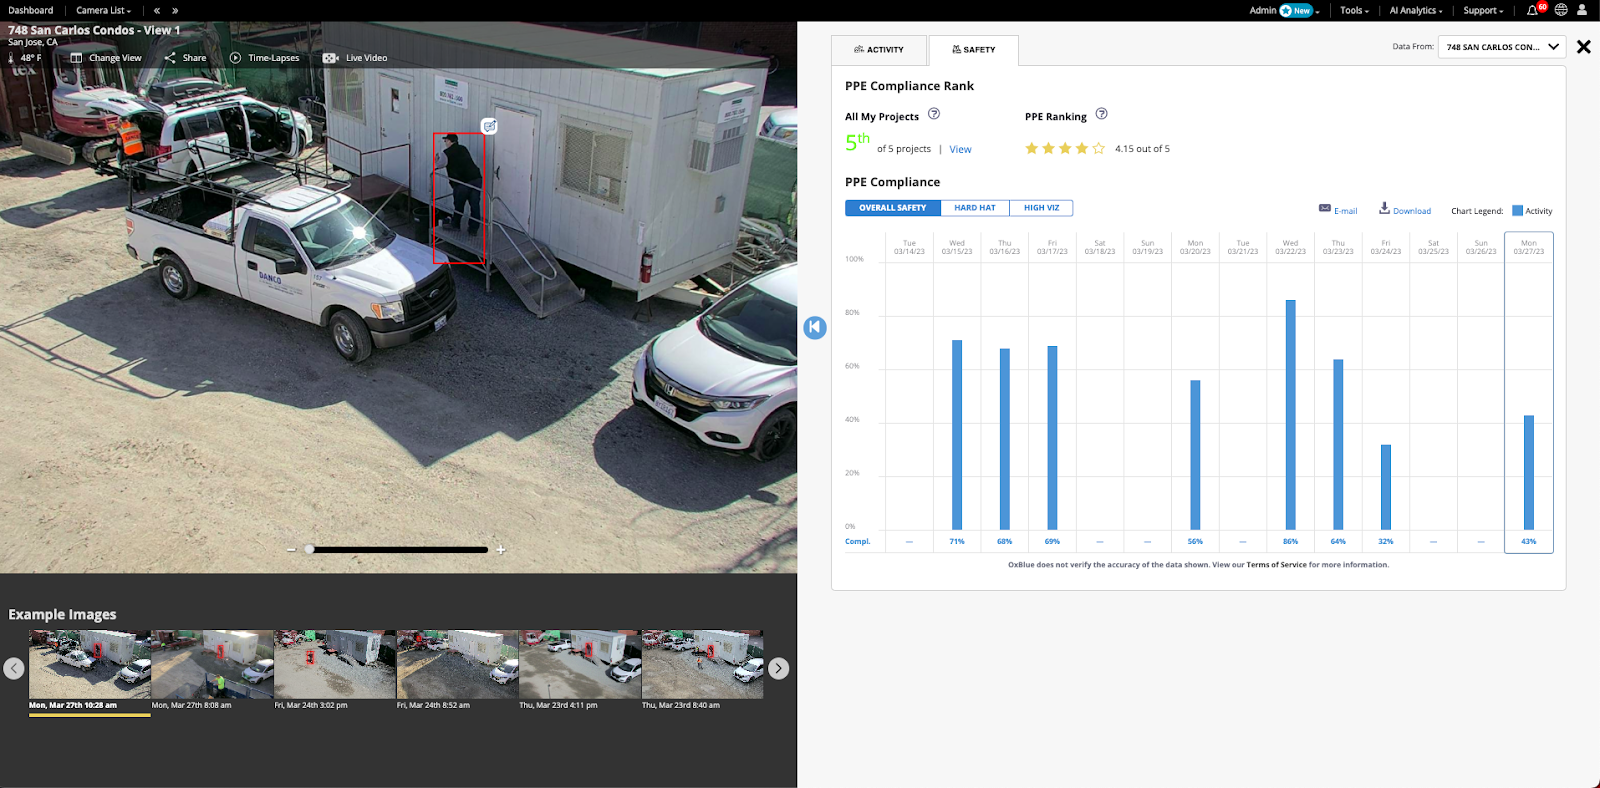
The most recent example images will display on the bottom left as thumbnails below the camera viewer in chronological order. Within the examples, you’ll see that anything the system has detected as a potential violation will be highlighted with a red box outline.
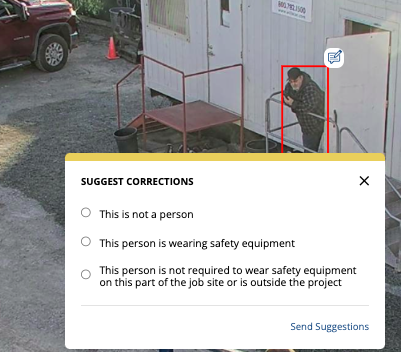
Note: If you notice a safety violation is inaccurate, you can select the comment box next to the red box outline and select a suggestion to send to our team.
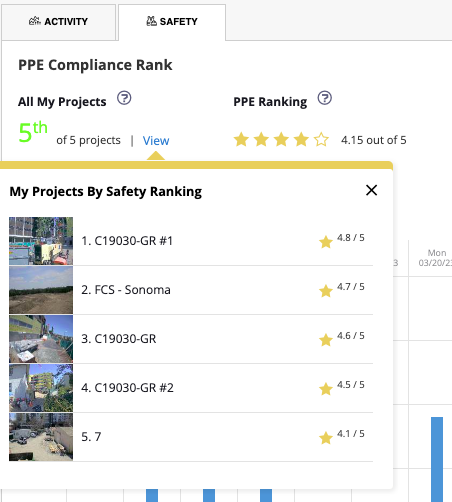
At the top you can view safety rankings of how you’re doing on a specific project and across multiple projects (if applicable). You can use the dropdown to view other project rankings.
You can email the image displaying the safety violation or download a csv file.
Note: Like Activity, if you have multiple cameras you can switch between cameras in the ‘data from’ dropdown menu on the right.
To close the AI Activity or Safety Analysis window, click the X in the upper right corner.