Note: In order to access the AI dashboard, you must have activity analysis enabled. Learn more on how to turn on the AI features.
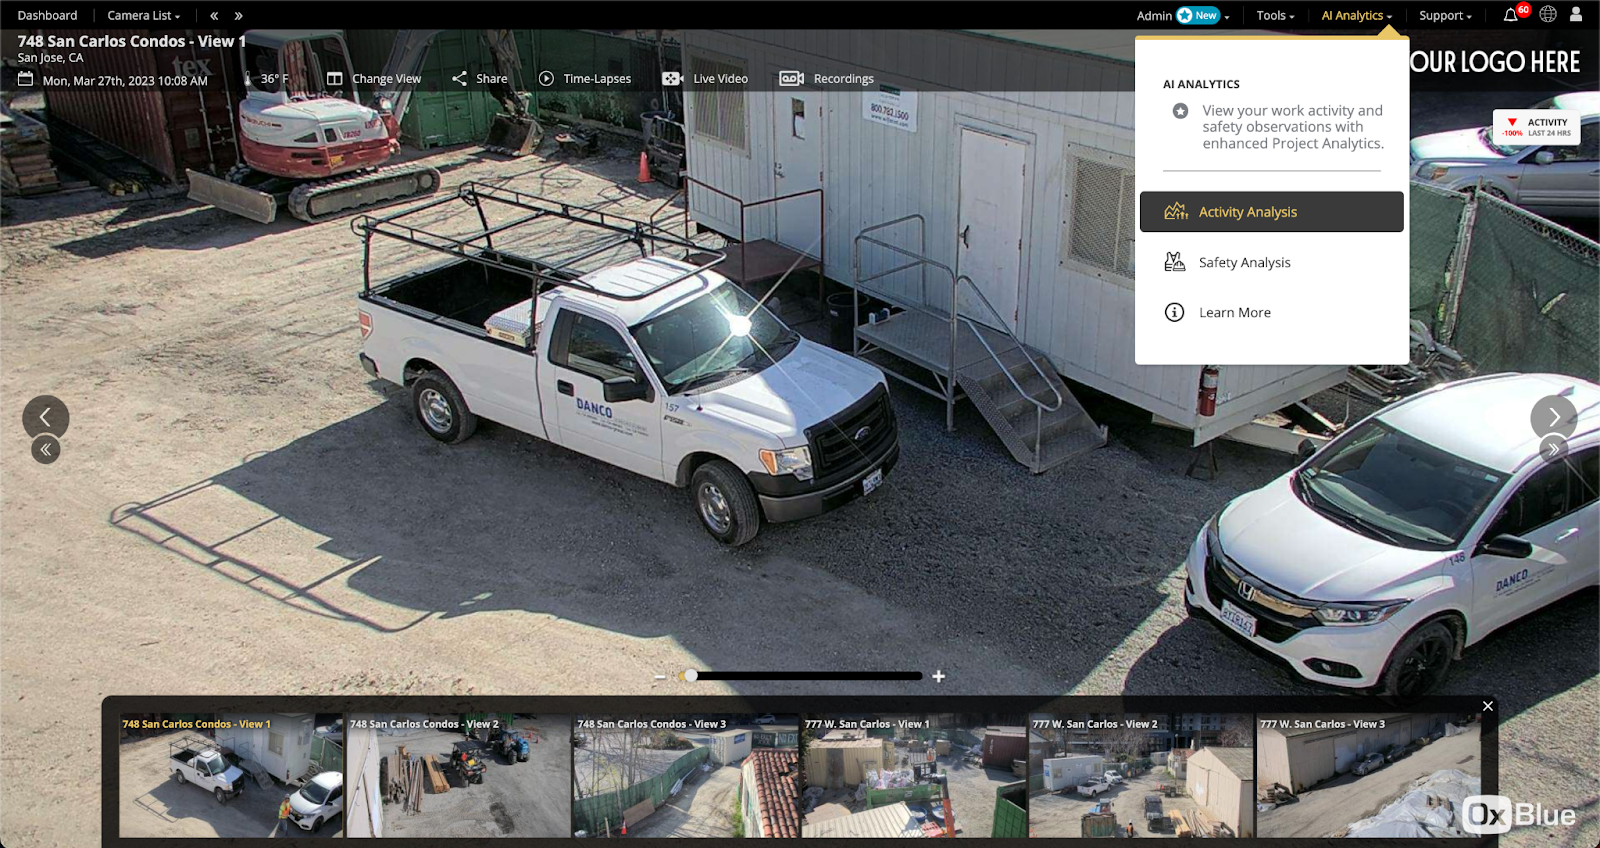
To view the Activity Analysis, click AI Analytics in the top-right menu and select Activity Analysis.
The AI Activity Analysis chart will be displayed to the right of the camera viewer.
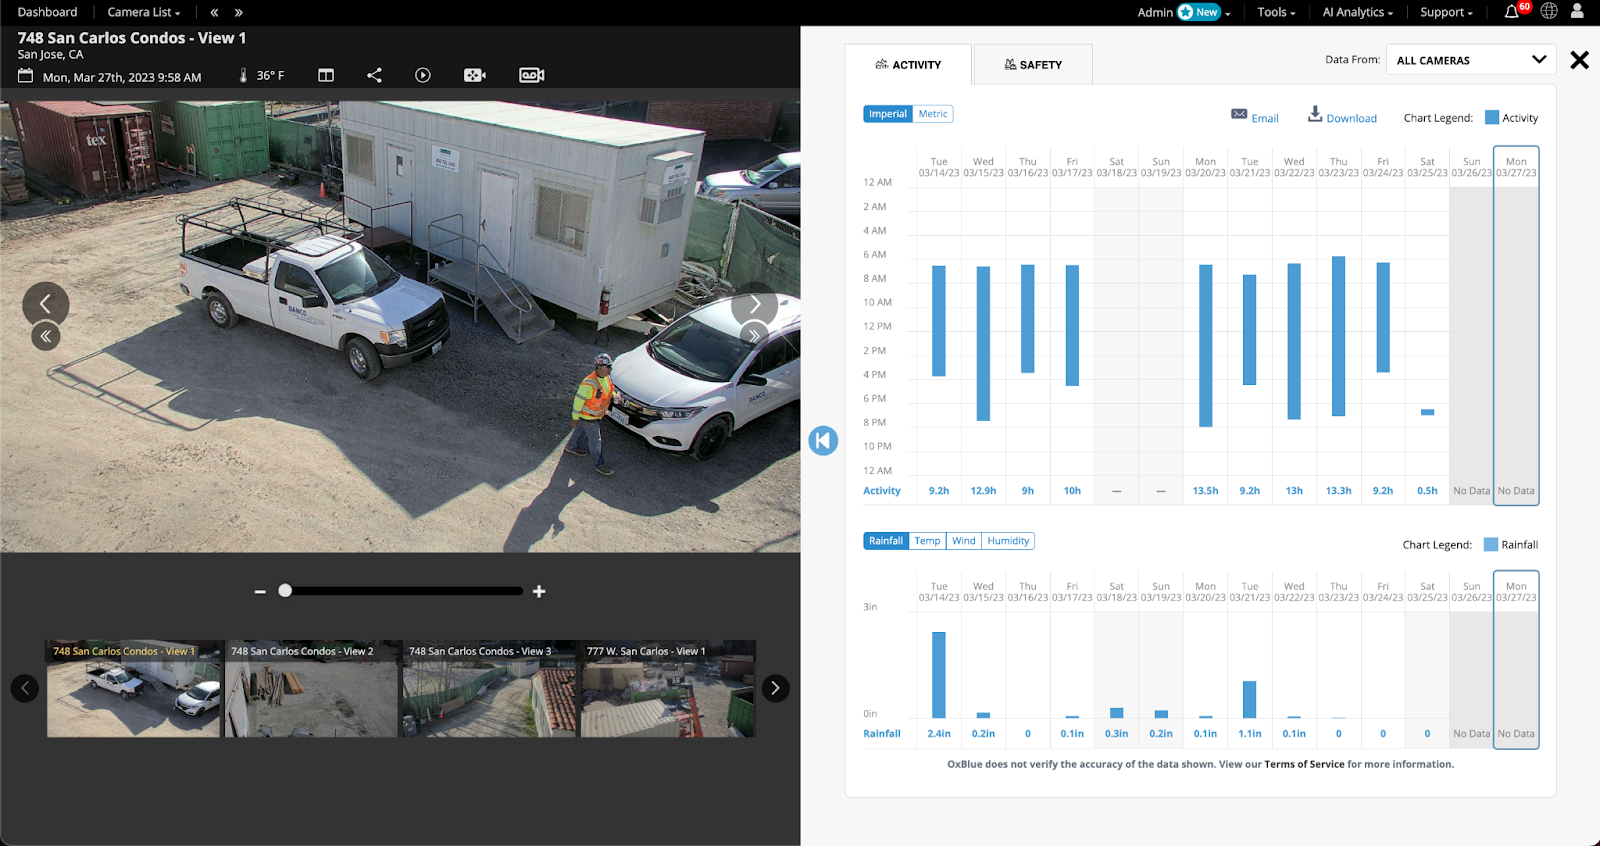
You can view activity analysis on the top chart at a glance or by hovering over the days. The chart will show when activity was first and last detected on site. When hovering over the days, the camera viewer on the left will change accordingly.
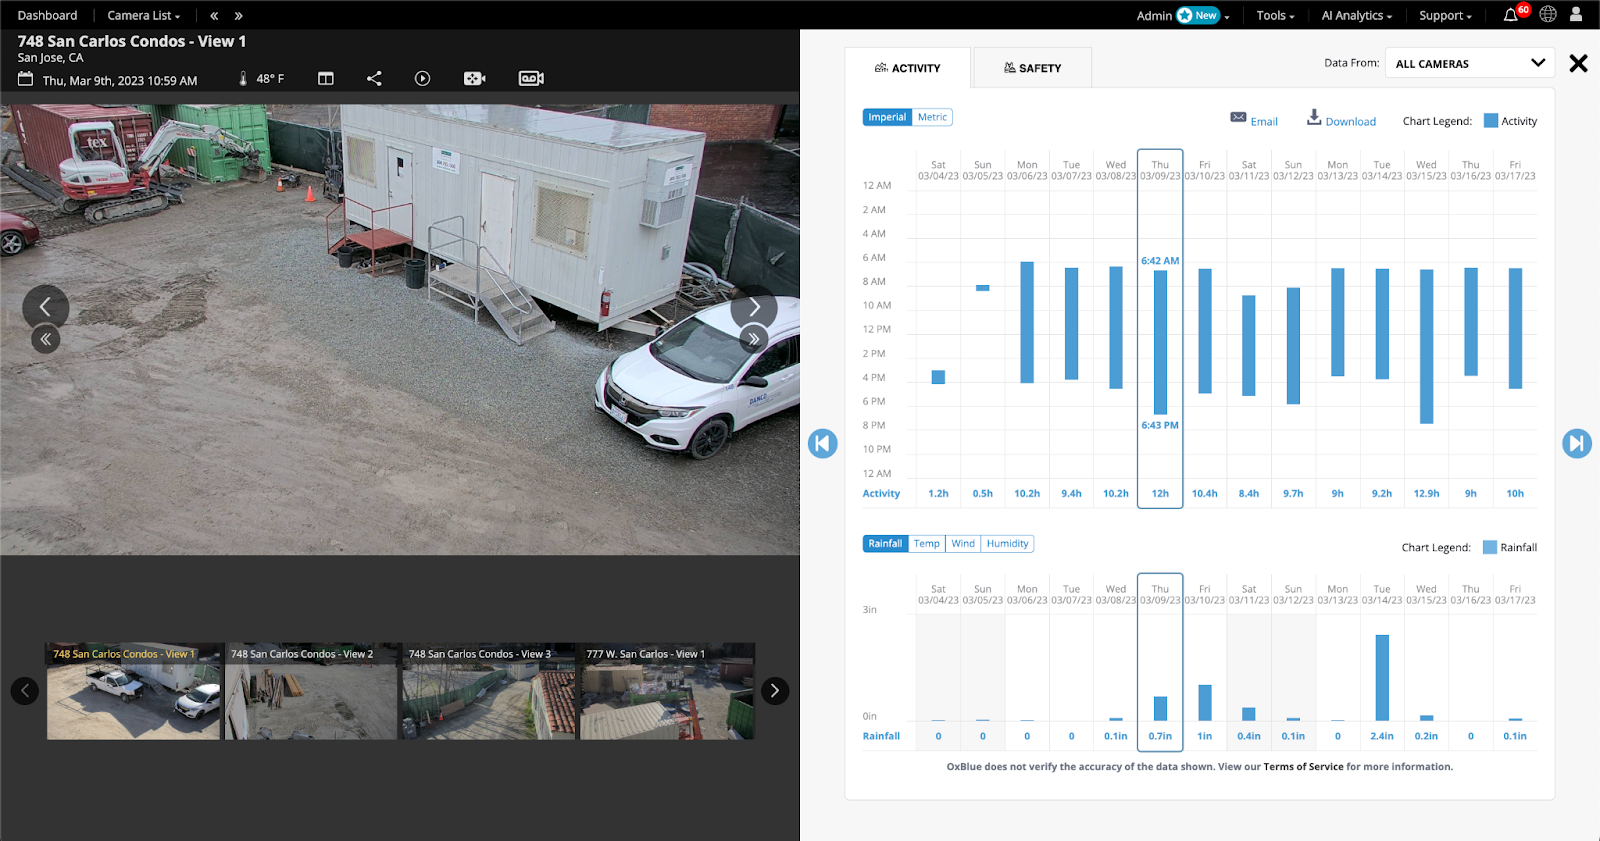
In addition you can view rainfall, temperature, wind, and humidity during specific days on the bottom chart.
Note: You can toggle between Imperial or Metric systems at the top underneath Activity.
If you have multiple cameras, you can switch between cameras in the ‘data from’ dropdown menu on the right.
To close the AI Activity Analysis window, click the X in the upper right corner.